|
Trends in the participation
rate: the role of school, retirement and discouragement
Deborah Sunter
Statistics Canada
May 1998
This decade opened with the longest economic downturn in Canadian history
since the "dirty thirties", and a recovery that appeared at first to be
almost "jobless". Strong employment gains and improvements to family income
in 1994 seemed to signal the end of the "jobless" recovery, but did not
last. Job growth was slow over all of 1995 and most of 1996. Only since
the beginning of 1997 has there been sufficiently strong job creation to
nudge up average family incomes and the employment rate, but the participation
rate has not followed suit.

Source: Labour Force Survey
Some view the 1989 peak participation rate as the "norm", and attribute
the failure of the rate to return to this norm primarily to labour market
discouragement in the face of slack demand.
This view has been reinforced by the fact that the US participation
rate, which had also fallen sharply during the early 1990s recession in
that country, recovered to pre-recession levels by 1994, and continued
to move higher in subsequent years. The failure of the Canadian rate to
match the US pattern appears to be another piece of evidence that weak
labour demand in Canada is keeping the lid on both the participation rate
and the unemployment rate.

Source: Current Population Survey, Labour Force Survey
However, the assumption that the drop in labour force participation
in the 1990s is almost totally accounted for by hidden unemployment in
the form of labour market discouragement needs to be questioned. An examination
of the age structure of the decline suggests that various forces have played
an important role, in particular, the increasing popularity of higher education,
and the trend to earlier retirement. Moreover, actual measures of labour
market discouragement indicate that this phenomenon is over-estimated when
defined as the shortfall between the current and pre-recession participation
rates.
Decomposing the drop in the participation rate by age
Equating the 1990s drop in the participation rate to hidden unemployment
is always a headline grabber, which claims that over half a million would-be
workers have abandoned the job market because of their belief that no suitable
jobs are available. Under this scenario, this large group is thought to
be likely to rejoin the labour force in greater numbers once strong job
growth is sustained, keeping the unemployment rate high for a prolonged
period of time.
The assumption underlying this argument is simply the application of
the 1989 participation rate to today’s working age population, attributing
the shortfall between this "expected" estimate of the labour force and
the actual estimate to discouragement.
When the same type of calculation is applied to three broad age groups,
it becomes clear that 90% of the shortfall between the expected and the
actual participation rates can be attributed to those who are either under
25 or over 54 year of age.
Between 1989 and 1997, youths aged 15 to 24 accounted for 62% of the
overall shortfall in the participation rate and those aged 55 or more accounted
for a further 28%. Only 10% came from the core working age group of 25
to 54 year olds. This is hardly the stuff of which headlines are made.

Source: Labour Force Survey
Furthermore, if one uses the US as a benchmark for the "normal" 1997
participation rate for Canada, these same two age groups contribute most
to the difference between the two countries. In fact, the participation
rate for 25 to 54 years olds was only 0.4 percentage points lower in Canada
than in the US in 1997. Therefore, any explanation of the shortfall in
the participation rate, compared with either the 1989 benchmark or the
current US benchmark) must focus on the younger and older groups.

Source: Currently population survey, US; LFS, Canada
Youths, school and labour force participation
Since youths accounted for almost two thirds of the overall shortfall
in the participation rate between 1989 and 1997, it is important to understand
how much of this contribution may be the result of a long-term trend to
more schooling, and how much the result of relatively poor labour market
conditions.
There is ample evidence that labour market conditions in the 1990s have
been generally difficult for youths. As usually happens during a recession,
their employment rate plunged in the early 1990s, reflecting a drop in
hiring, and a greater risk of layoff for those with lower skills and little
seniority. However, six years after recovery began, the youth employment
and participation rates remain at or near their recession troughs and their
unemployment rate remains stubbornly high.

Source: Labour Force Survey
Over the same period, full-time school attendance rates have risen sharply,
from 48.3% in 1989 to 55.3% in 1993 and a record 57.7% in 1997. While the
pace of growth in school attendance rates picked up considerably in the
early 1990s, perhaps reflecting some degree of discouragement with labour
market conditions, with school as a second best alternative, the upward
trend in attendance is far from new. From 40% in 1976, full-time attendance
rates rose strongly throughout the expansion years of the late 1980s, when
the labour market situation for youths was very robust.
Available data also indicate that the total school attendance rate for
Canadian youths aged 16 to 19 and 20 to 24 were slightly greater than the
comparable 1997 US rates, and have also grown more sharply since 1989.
This may explain some of the inter-country difference in the participation
rate trend for this age group.

There can be little doubt that youths share the general awareness that
more than ever before, labour market success is tied to both initial educational
attainment and skills developed through work experience and on-going training.
There is considerable evidence that young people seeking entry into almost
any field of work today require much higher qualifications than did their
parents 20 years ago (Crompton, 1995).
Whatever the reason for the upward shift to more schooling, the result
is a direct dampening effect on labour force participation since students
are much less likely to be working or looking for work than their non-student
counterparts.
Participation rates for student and non-student youths
| |
1980 |
1989 |
1993 |
1997 |
| Students |
35.0 |
47.0 |
43.2 |
39.7 |
| Non-Students |
84.3 |
86.5 |
83.2 |
84.2 |
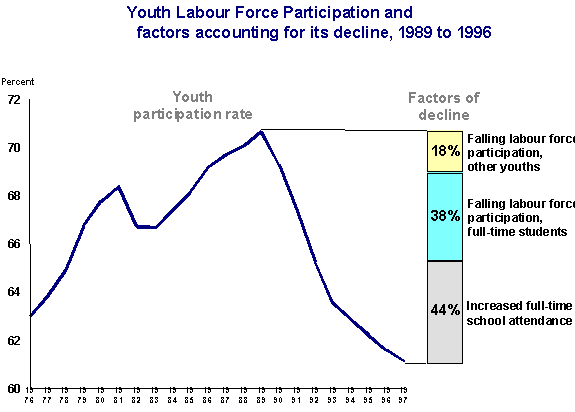
A shift-share analysis of the decline in youth labour force participation
between the school years of 1989 and 1996 (Jennings, HRDC, 1997) shows
that almost half (44%) can be attributed to the upswing in school attendance.
A further 38% is due to a drop in the proportion of students participating
in the labour force. Only 20% is due to a decline in participation among
non-students.
Source: Labour Force Survey
Jennings’ decomposition focuses on the school year. It is also important
to look at the summer months, since students play a very large role in
Canada’s labour market from May to August. On average, they typically account
for about 10% of all labour force activity every summer.
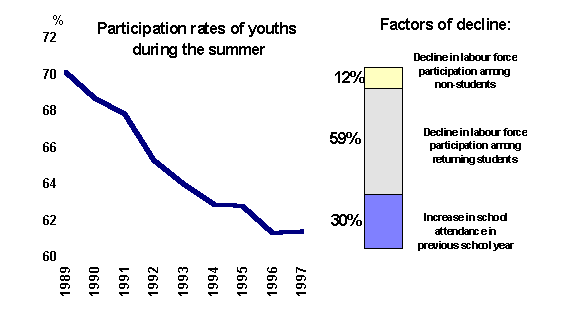
Applying the same type of shift-share analysis to the summer months,
we find increased school attendance in the school year also has a dampening
effect on labour force participation from May to August. Growth in the
proportion of youths who were between school years accounts for about 30%
of the overall decline in the youth participation rate from the summer
of 1989 to 1997. Almost 60% of the shortfall comes from a drop in labour
force participation among returning students. Only 12% is associated with
lower participation among those who have left school.
Source: Labour Force Survey
The impact of earlier retirement on participation rates
Those aged 55 and over are the second greatest contributors to the overall
decline in the participation rate over the 1990s. This group is also the
source of the greatest difference between U.S. and Canadian participation
rates in 1997, but the gap began in the mid-1980s and has widened since
then.
The labour force participation rate of men aged 55 to 64 has been on
a long-term decline, falling from 76.7% in 1976 to 58.9% in 1995. In 1996
and 1997, the rate actually edged up slightly for the first time in over
twenty years. (This appeared to signal an end to the long-term downward
trend, but the rate for this group has edged down again in the first few
months of 1998). In contrast to older men, older women have been increasingly
likely to participate in the labour force, as their participation rates
have risen from 31.8% in 1976 to 36.5% in 1997.

Source: Labour Force Survey
The decline in the participation rate for men in the 1970s and 1980s
was likely due to the growing numbers who were retiring earlier, taking
advantage of the public and private pension plan programs available to
them. Over the 1990s, the average age at retirement has continued to fall,
although at a slower pace than in the 1980s (Gower, 1997).
However, the continuation of the decline in labour force participation
for men aged 55+ in the 1990s, has led to concern that this group is now
at greater risk of involuntary job loss than younger workers – in a labour
market that increasingly values post-secondary education, technological
skill and flexibility.
How much of the continued decline in older men’s participation rates
is due to voluntary retirement, and how much has been induced by discouragement
following involuntary job loss? The data suggest that both factors are
contributors.
Between the late 1970s and early 1990s, the risk of permanent layoff
changed very little for the overall working population (Picot et al, 1997).
But the risk actually increased slightly for older workers over this period.
While least likely to experience an involuntary job loss in the late 1970s,
older workers’ permanent layoff rate rose over the 1980s, and was slightly
higher than workers aged 35 to 54 by 1994. However, the increase has not
been strong: the permanent layoff rate for older men rose from 6.9% to
8.6%. For women, the increase was even smaller, from 3.9% to 4.5%.

Source: Analytical Studies Branch, STC
While the risk of layoff has risen only slightly, there are groups of
older workers who appear to be especially vulnerable: those with relatively
low levels of education, and those in the higher unemployment areas of
the Atlantic provinces and Quebec. The perception of vulnerability is probably
reinforced by the fact that, once laid off, older workers have a much harder
time finding a replacement job than younger adults, especially the majority
who lack post-secondary qualifications (STC, 1998).
The impact of job loss for older workers is far from homogeneous. For
example, a significant proportion of older workers who lost jobs in the
1990s were government workers, most of whom were probably eligible for
early retirement packages that provided a bridge to their normal retirement
benefits. Those who experienced job loss without such compensation are
clearly at a disadvantage, at least until they are old enough to receive
C/QPP benefits. In the interim, they may face serious barriers to re-employment.
Reasons for retirement are complex and diverse, but there is little
indication that the continued drop in the average age of retirement has
been solely the result of forced exits from the labour force. In fact,
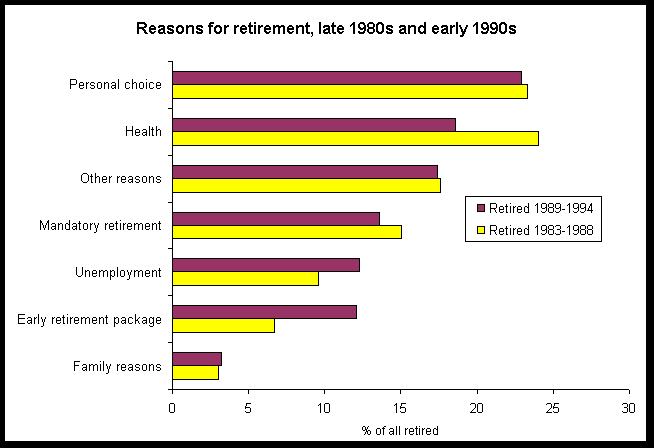
the reasons for retirement, as measured by Statistics Canada’s General
Social Survey, changed only marginally between the expansion years of the
1980s and the recession-dominated years of the early 1990s. While there
was almost a doubling in the proportion who retired because of early retirement
incentives, up from 7% to 12%, the proportion reporting unemployment as
their main reason for retirement rose only slightly, from 10% to 12%. Personal
choice and health remained the leading reasons in the early 1990s.
Source: General Social Survey, STC, 1994
Measuring Discouragement Directly from the LFS
The Labour Force Survey measures discouragement directly through a series
of explicit questions. Respondents to the survey who are not currently
employed nor looking for work are classified as discouraged depending on
their responses to the following questions:
Did you want a job last week?
What was the main reason you did not look for work last week?
Could you have worked in the last week if a suitable
job had been offered?
The following table presents a breakdown for 1997 of the Canadian working
age population by labour force status, and further subdivides the not in
the labour force group according to responses to the above questions.

Those who want a job, and are available for work but did not look because
they believe no suitable work is available are classified, in accordance
with international standards, as discouraged. While they are not
included in the official estimates of the labour force and unemployment,
this group is closely monitored since they do represent a potential labour
supply, and provide a barometer of labour market conditions. Similarly,
those who want a job, and are available, but did not look because they
are waiting for replies or recall from employers, while not discouraged,
are also on the margins of the labour force, and are not active for economic
reasons (Jones and Riddell, 1993).
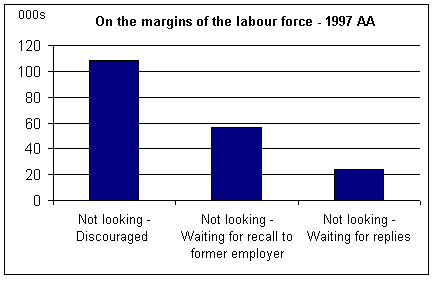
One would expect that if the shortfall between the "expected" participation
rate and the actual participation rate in 1997 were the result of hidden
unemployment, the estimate of those not active in the labour force for
economic reasons would be of about the same magnitude --- over half a million.
However, over 1997, there were an average 188,000 who were not in the labour
force for economic reasons, and within this group, 108,000 discouraged
workers.
Discouragement is not evenly spread
Expressed as a percentage of the labour force, discouragement is relatively
low, at 0.7% overall. This stands in considerable contrast to the 3.6 %
that results from the assumption that discouragement accounts for the shortfall
between the 1989 and 1997 participation rates
As a percentage of the labour force, the proportion is highest for women
and men aged 55 and over, and lowest for core-aged workers. This pattern
also holds when the measure is broadened to include all those on the margins
of the labour force because of economic reasons (discouragement, waiting
for replies or recall).
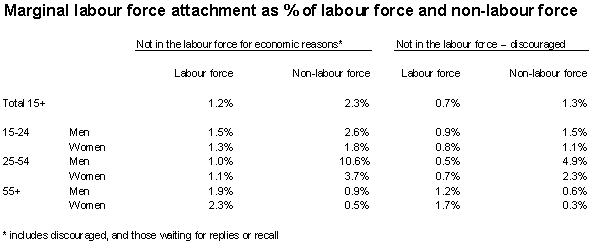
When the non-labour force is used as the denominator, the pattern changes.
Since most core-age men and many core-aged women have little alternative
to participating in the labour market, those who are not are more likely
to be discouraged or marginally attached in some way, than older and younger
cohorts.
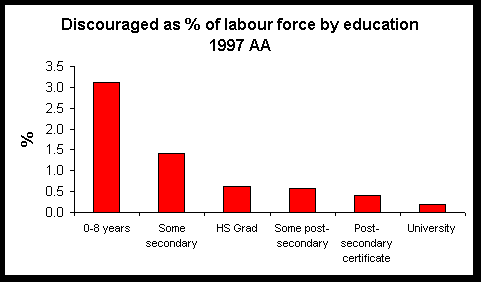
Education makes a large impact on the likelihood of discouragement.
At 3.1%, the discouraged to labour force rate is over six times greater
for those without any secondary education than those with a post-secondary
certificate (0.4%) or university degree (0.2%).
Source: Labour Force Survey
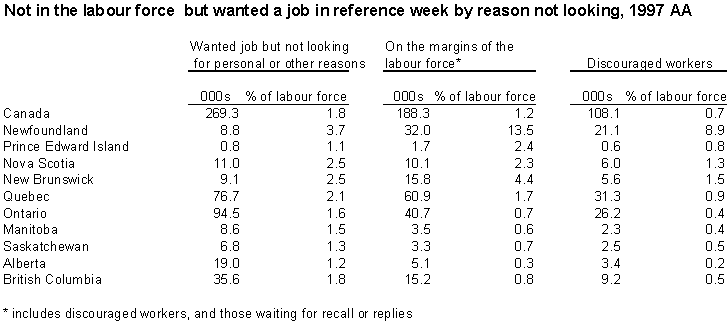
In relative terms, labour market discouragement tends to be high in
areas with chronically high unemployment rate, most notably, Newfoundland.
Rates are also above the national average in the other Atlantic provinces
and Quebec, and below average in Ontario and the western provinces.
Conclusion
It is important to estimate the degree of hidden unemployment in the
form of discouraged workers since this provides a reasonable indication
of the potential labour supply and the shortfall in labour demand. It also
provides useful information about the extent of labour market hardship
that extends beyond that captured in the official unemployment rate.
However, discouragement is not easily estimated, either directly or
indirectly, since it is not manifest through objectively measurable activity.
There is no active demonstration of willingness to supply labour, only
an expression of interest and a stated perception that suitable jobs are
not available, making job search futile.
The failure of the participation rate to return to, and then exceed,
1989 levels has sparked a great deal of interest and debate. Many observers
attribute the shortfall between the current participation rate and that
of 1989 as an indicator of the extent of labour market discouragement.
However, an examination of the age structure of the decline suggests that
structural forces have played an important role, in particular, the increasing
popularity of higher education, and the trend to earlier retirement. These
findings are further supported by the direct measure of discouragement
from the LFS, which, at 108,000 in 1997, is a great deal lower that an
estimate based on the difference between the current and pre-recession
participation rates.
References:
Crompton, S. Employment prospects for high school graduates,
Perspectives on Labour and Income, STC, Cat. 75-001, Autumn 1995.
Gower, D. "Measuring the age of retirement", , Perspectives
on Labour and Income, STC, Cat. 75-001, Summer, 1997.
Jennings, P. What is behind the declining youth participation rate?,
Applied Research Bulletin, HRDC, Summer-Fall 1997
Jones, S. and Craig Riddell. The Measurement of unemployment: an
Empirical Approach. UBC Department of Economics, Discussion paper No.
93-48, December 1993.
Picot, Garnett, Zhengxi Lin and Wendy Pyper. "An overview of permanent
layoffs", Perspectives on Labour and Income, Catalogue no. 75-001-XPE,
Autoumn 1997, vol. 9 no. 3, Statistics Canada.
Statistics Canada, Labour Force Update: Older Workers. Catalogue
no. 71-005-XPE, Spring 1998
|